HUGHESNET / CUSTOMER PORTAL REDESIGN

Simplifying the customer experience.

Redesigning the customer portal to make billing, data usage, and self-service easier to manage.

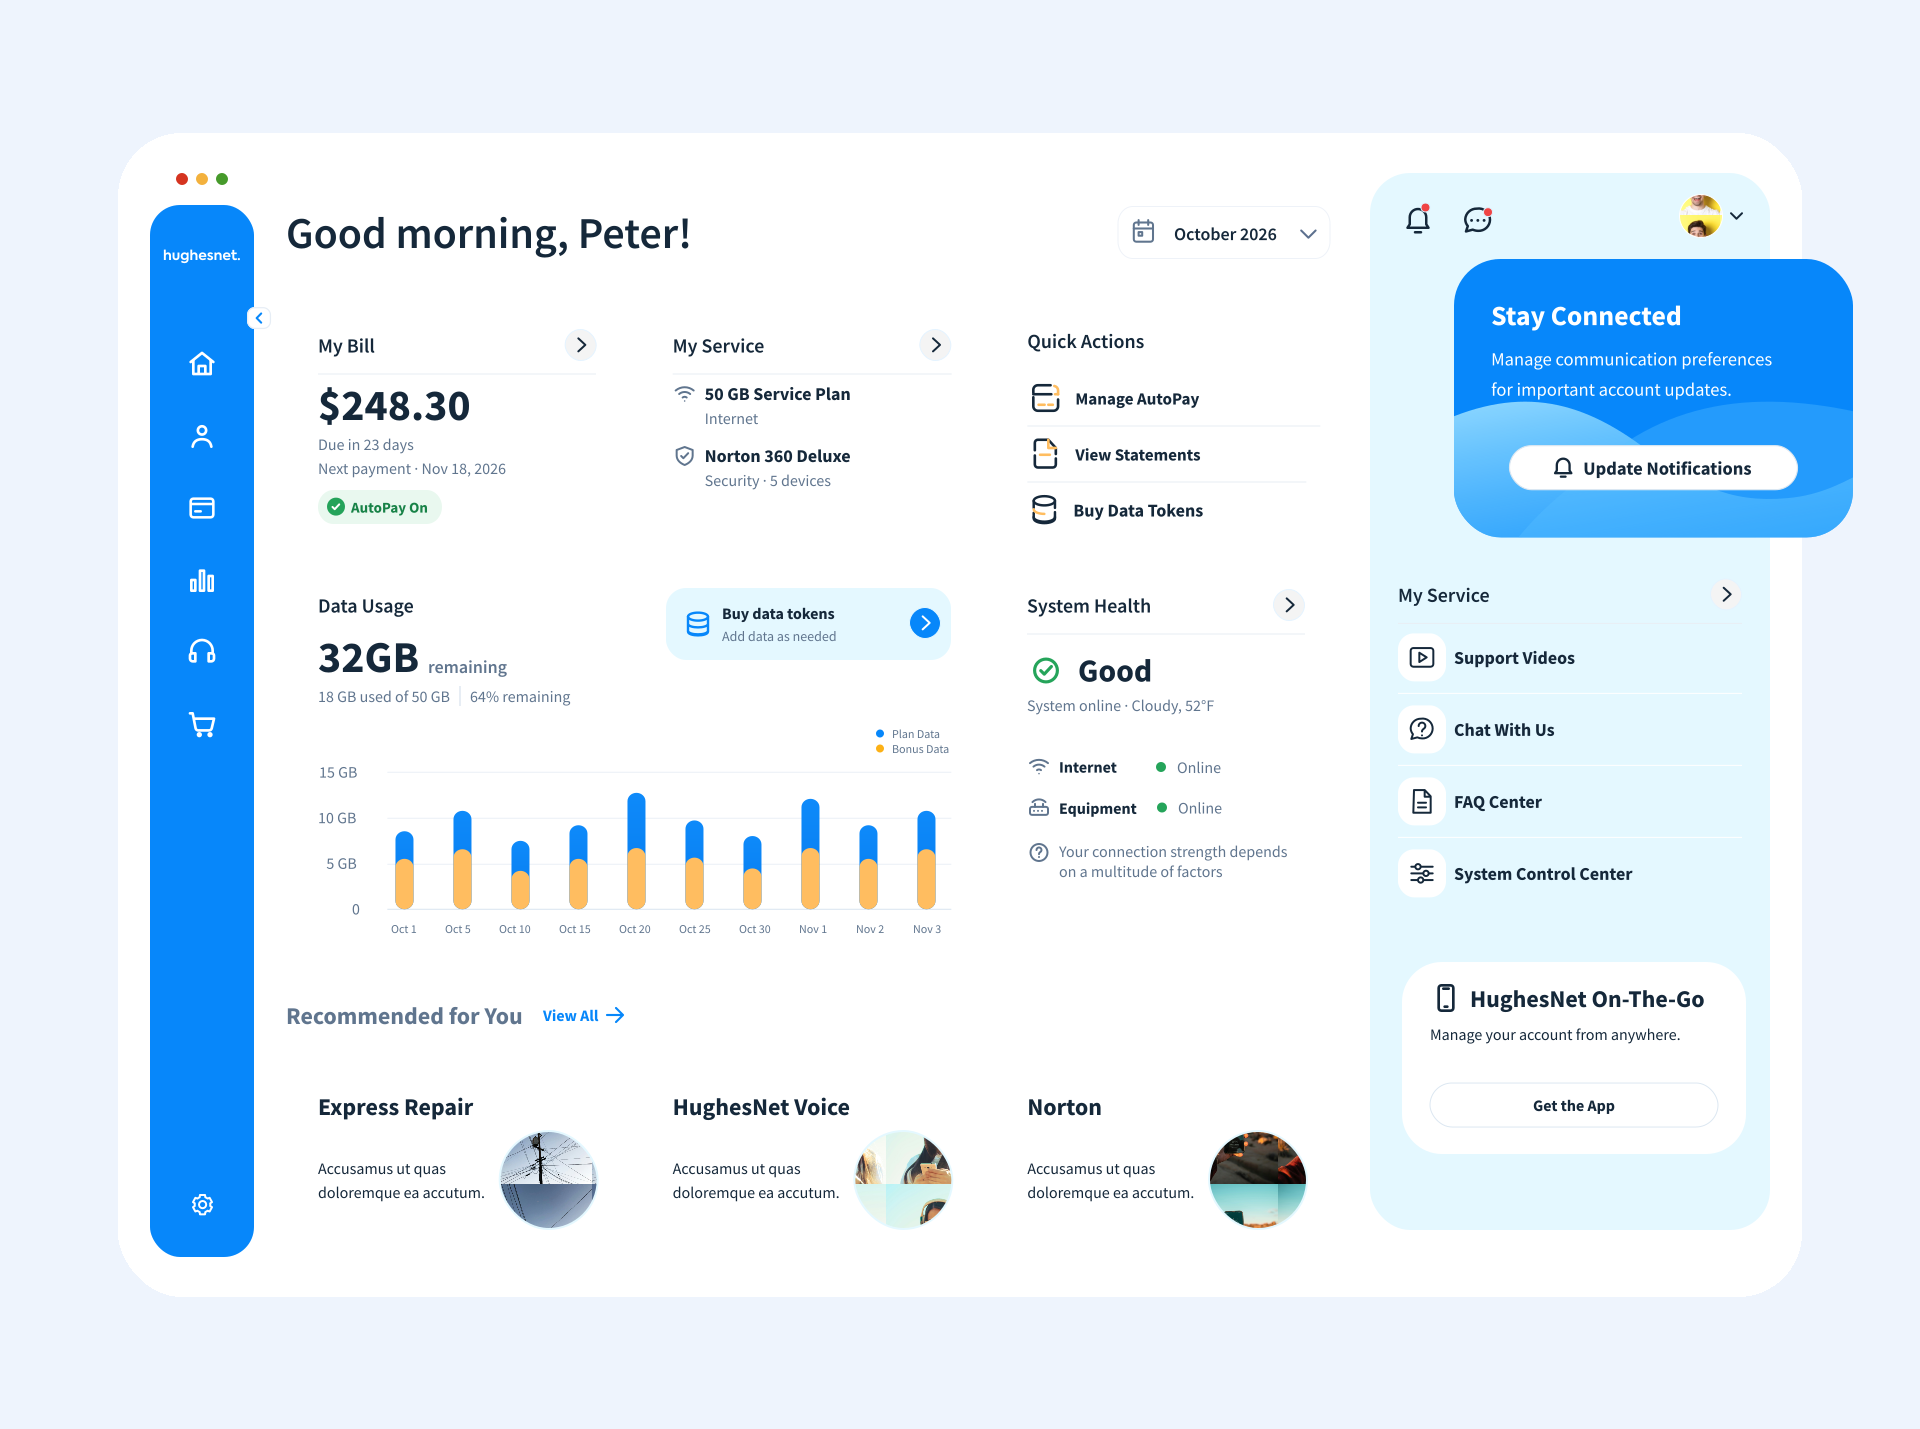
HughesNet dashboard redesign V2 with left navigation, Quick Actions, billing and service cards, a wide data-usage chart, and a supporting right rail
02 / 13 · The challenge

Simple tasks were harder than they should be

Customers needed quick access to billing, data usage, and support, but the experience was crowded.

70%
Support demand

Of customer care calls related to connectivity, billing, and data management, according to the project brief.

7
Competing modules

The account overview presented billing, announcements, system health, usage, services, offers, and links.

3
Business priorities

Improve registration, reduce support dependency, and support discovery of optional services.

03 / 13 · Insights

Start with what customers actually need

The brief identified billing, account information, and data usage as the highest-priority customer tasks.

01 · Most frequent
Billing first

Customers primarily visited to understand bills and manage payments.

02 · Essential context
Account and usage

Service information and data usage needed to be easy to locate.

03 · Self-service
Help when needed

Existing troubleshooting and FAQ resources were not prominent enough.

04 / 13 · User journey / experience mapping

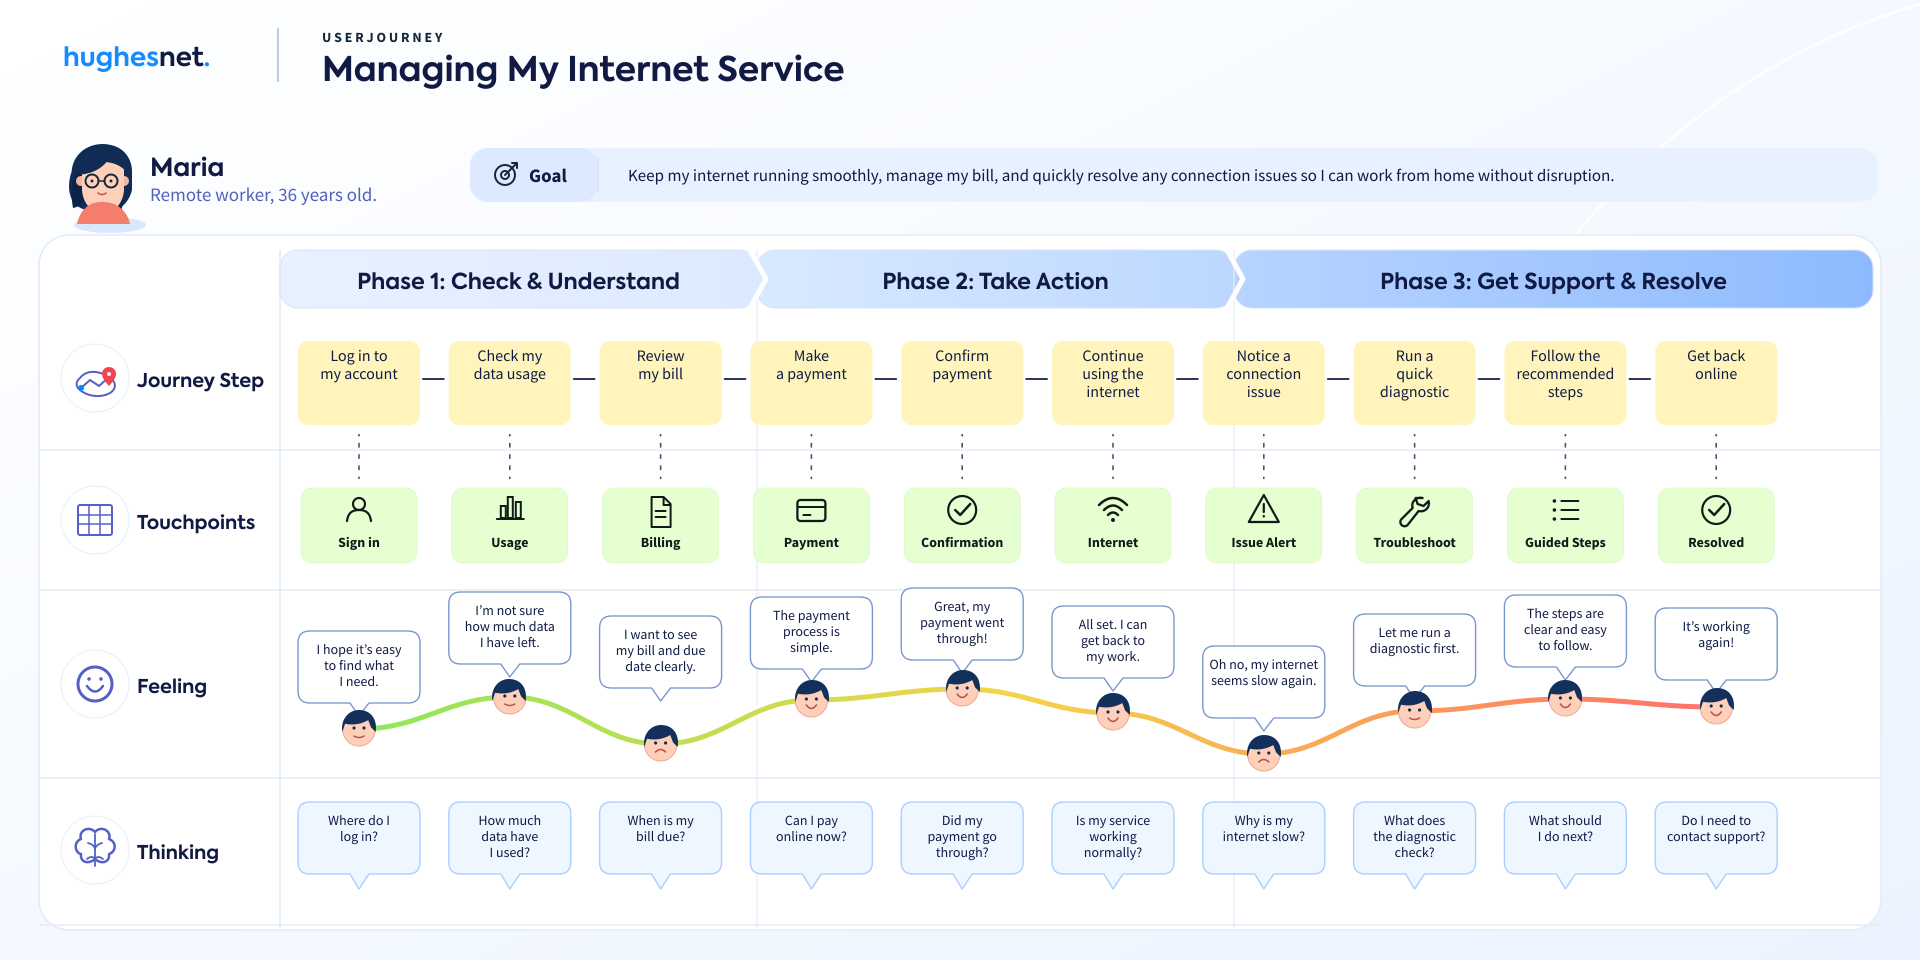
From checking usage to getting back online.

Illustrative customer journey across account management, payments, and connectivity support; not validated user research.

Illustrative HughesNet customer journey map showing phases of checking and understanding service, taking action, and resolving connectivity issues
05 / Original Experience

Where the old dashboard fell short.

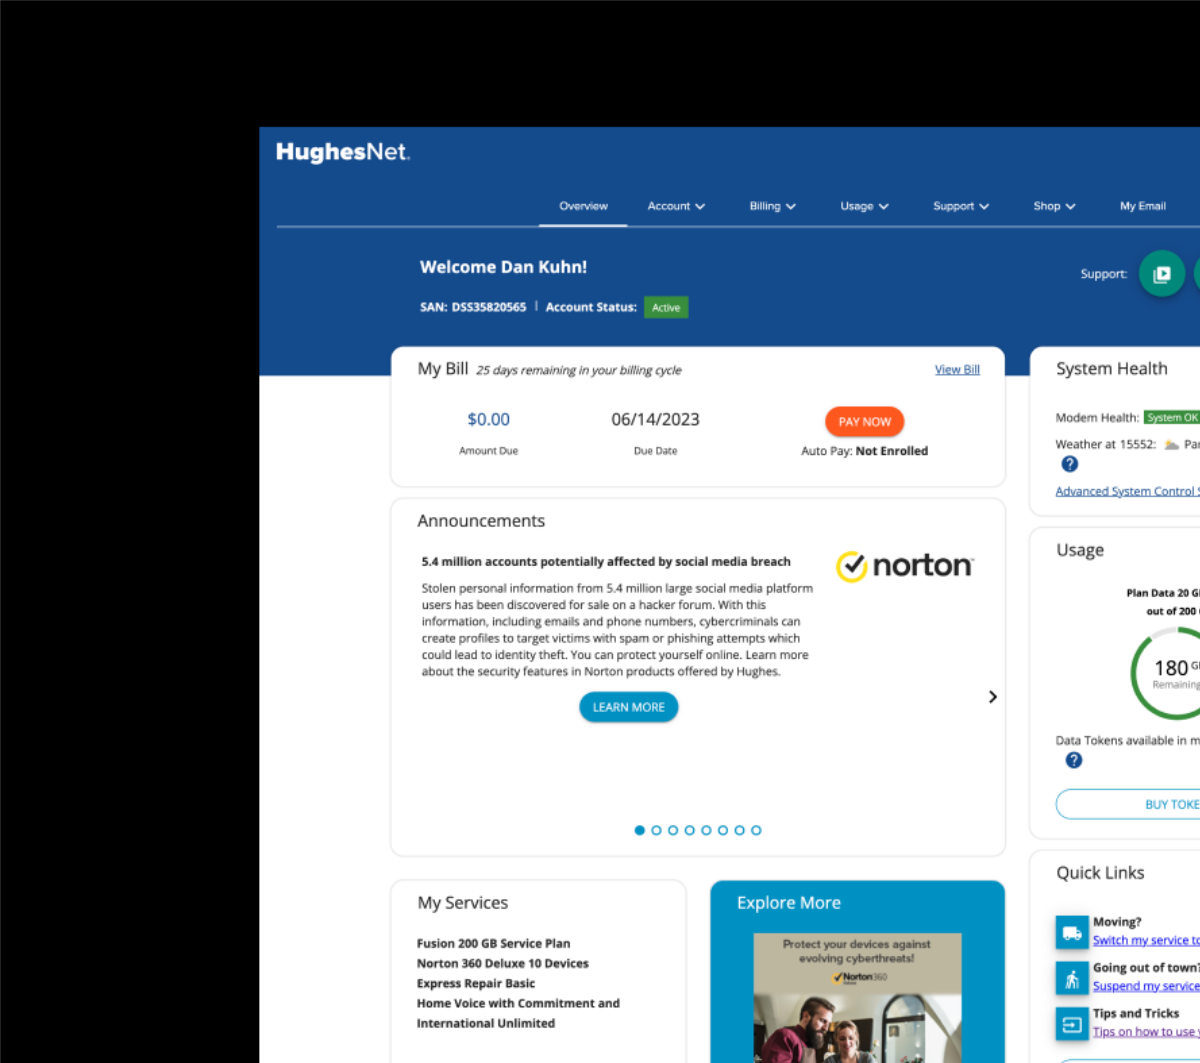
Original HughesNet dashboardBefore redesign
Original HughesNet customer dashboard
Original customer portal
  1. Billing & Usage

    Essential account information competed with announcements.

  2. Navigation

    Key actions were scattered across multiple entry points.

  3. System Health

    Technical status lacked clear explanations and next steps.

  4. Connectivity

    Troubleshooting wasn’t integrated into the main workflow.

Design opportunity: Make essential tasks easier to find, understand, and complete.

06 / 13 · Strategy

Organize the experience around everyday tasks

Make critical information immediately visible, keep support accessible, and give offers a secondary role.

Proposed information hierarchy
01 Billing02 Account details03 Data usage04 Support05 Offers & announcements

Priorities reflect the client brief; the layout is a simplified storytelling diagram, not a usability-tested ranking.

07 / 13 · Exploration

Explore before committing to a direction

I explored information hierarchy and competing layout approaches before refining the high-fidelity dashboard.

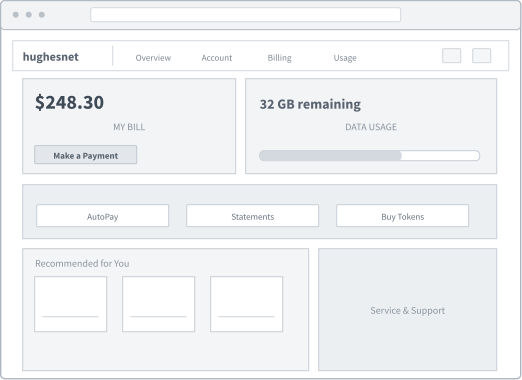
01

Information Inventory
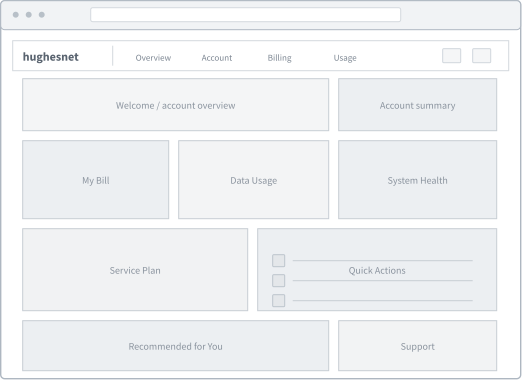
HughesNet desktop wireframe: Information Inventory

Too many competing priorities.

Account information is presented with similar emphasis, making essential tasks harder to identify.
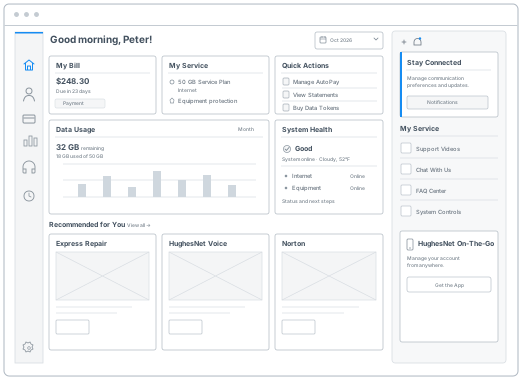
02

Task-First

HughesNet desktop wireframe: Task-First

Make essential tasks easier to find.

Bring billing and data usage forward while giving common actions a clearer entry point.
03

Balanced Layout

HughesNet desktop wireframe: Balanced Layout

Separate primary and supporting content.

Use a focused main workspace and a quieter right-side panel for supporting information.

These low-fidelity wireframes illustrate the evolution of the information architecture; they are retrospective case-study reconstructions, not claimed original research artifacts.

08 / DESIGN ITERATION

Designing for real-world conditions.

Balancing clarity, flexibility, and consistency across customer account states.

  1. 01Prioritize essential tasks

    Billing, usage, and service status take priority over promotional content.

    Keep primary tasks in the main content area and supporting information in the right panel.

  2. 02Make data easier to scan

    Usage information needs sufficient space without overwhelming the dashboard.

    Give the usage chart more room while keeping related controls contextual.

  3. 03Simplify account actions

    Repeated calls to action increase visual noise.

    Consolidate frequent tasks into Quick Actions and show contextual actions only when needed.

  4. 04Adapt to account states

    Payment issues, high usage, and connectivity problems need clear feedback.

    Change the affected component, status, and CTA while preserving the overall dashboard layout.

09 / 13 · UI components / interaction states

One component system. Two themes.

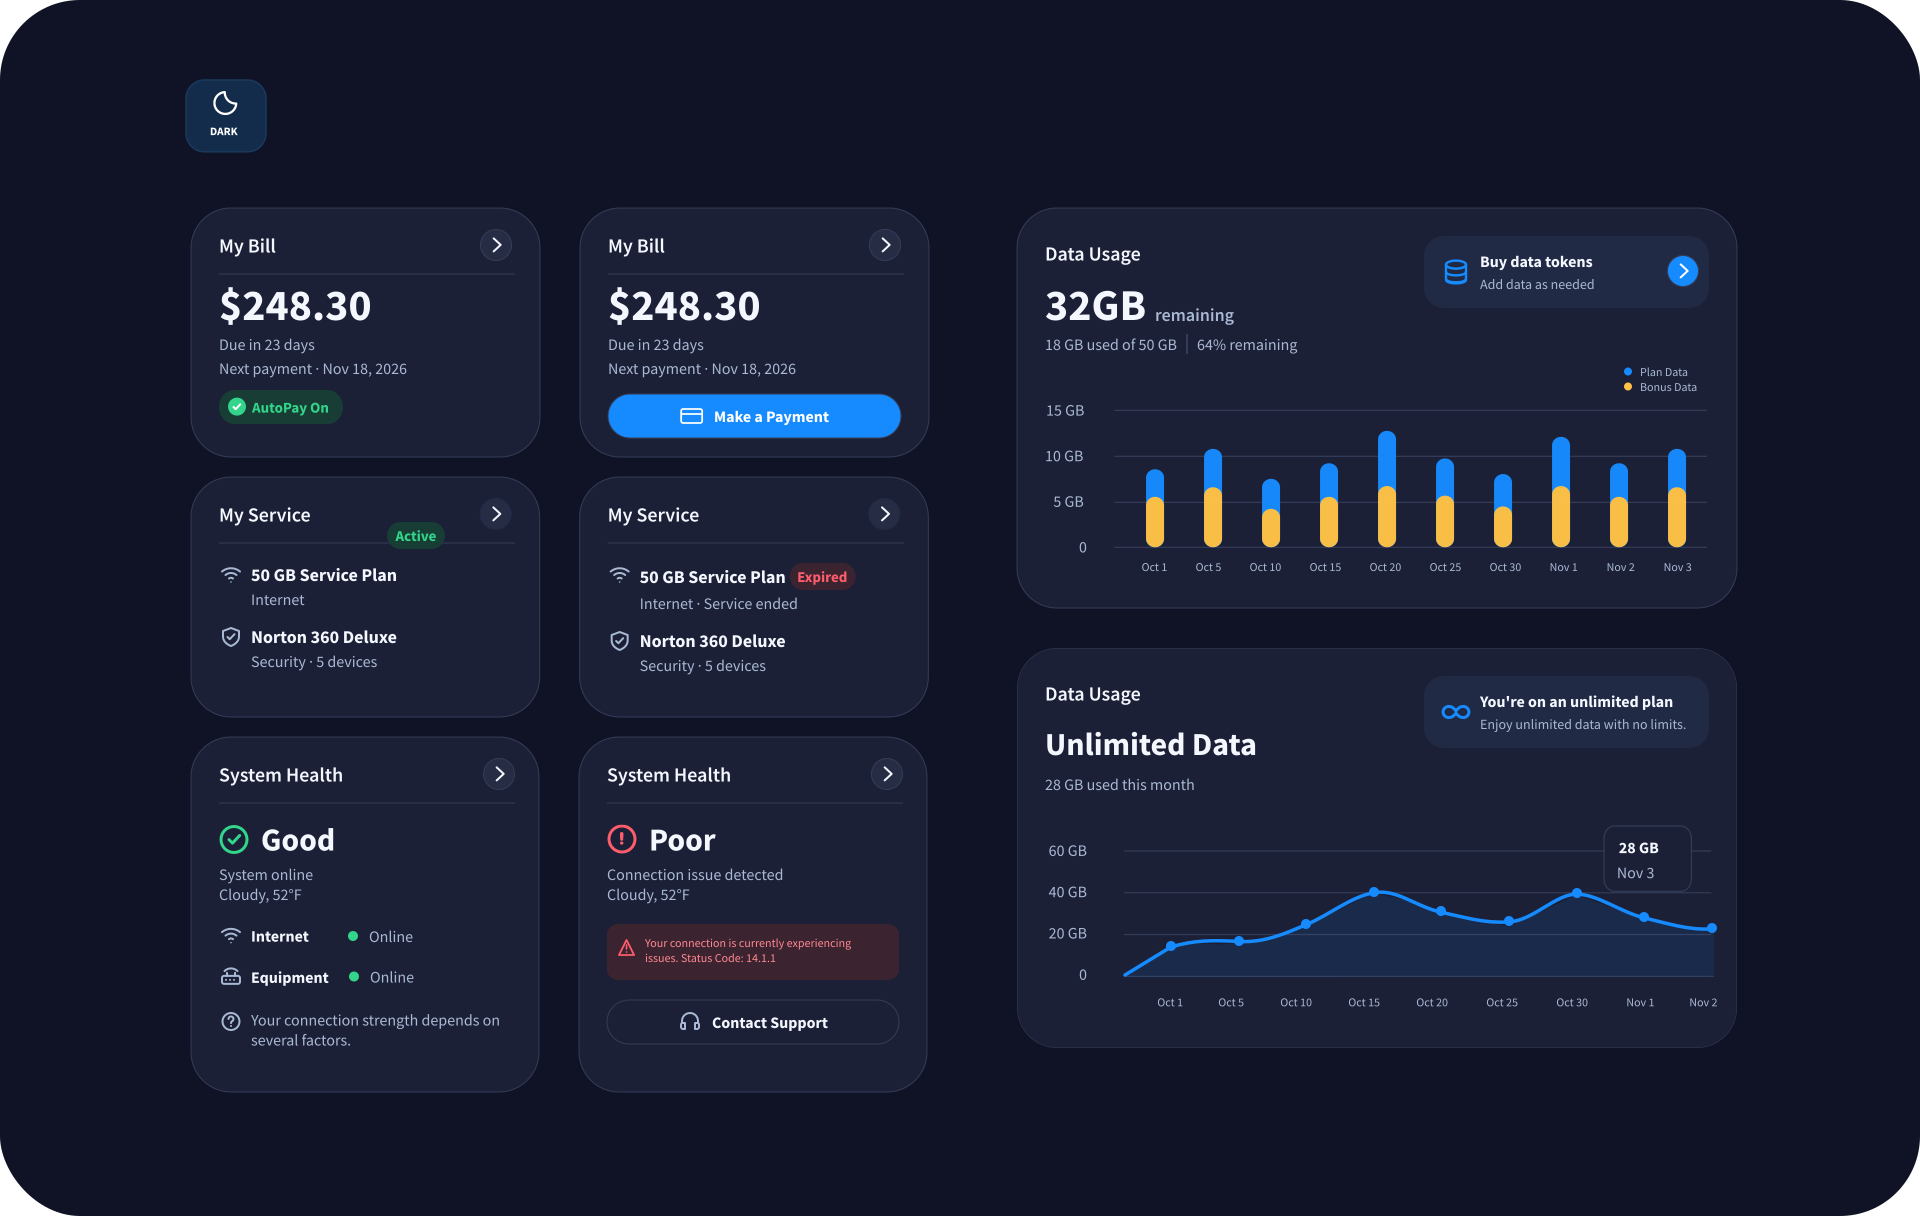
Billing, service, data usage, and system health adapt to different customer conditions. The light and dark component libraries show the available states side by side, without changing the dashboard’s underlying structure.
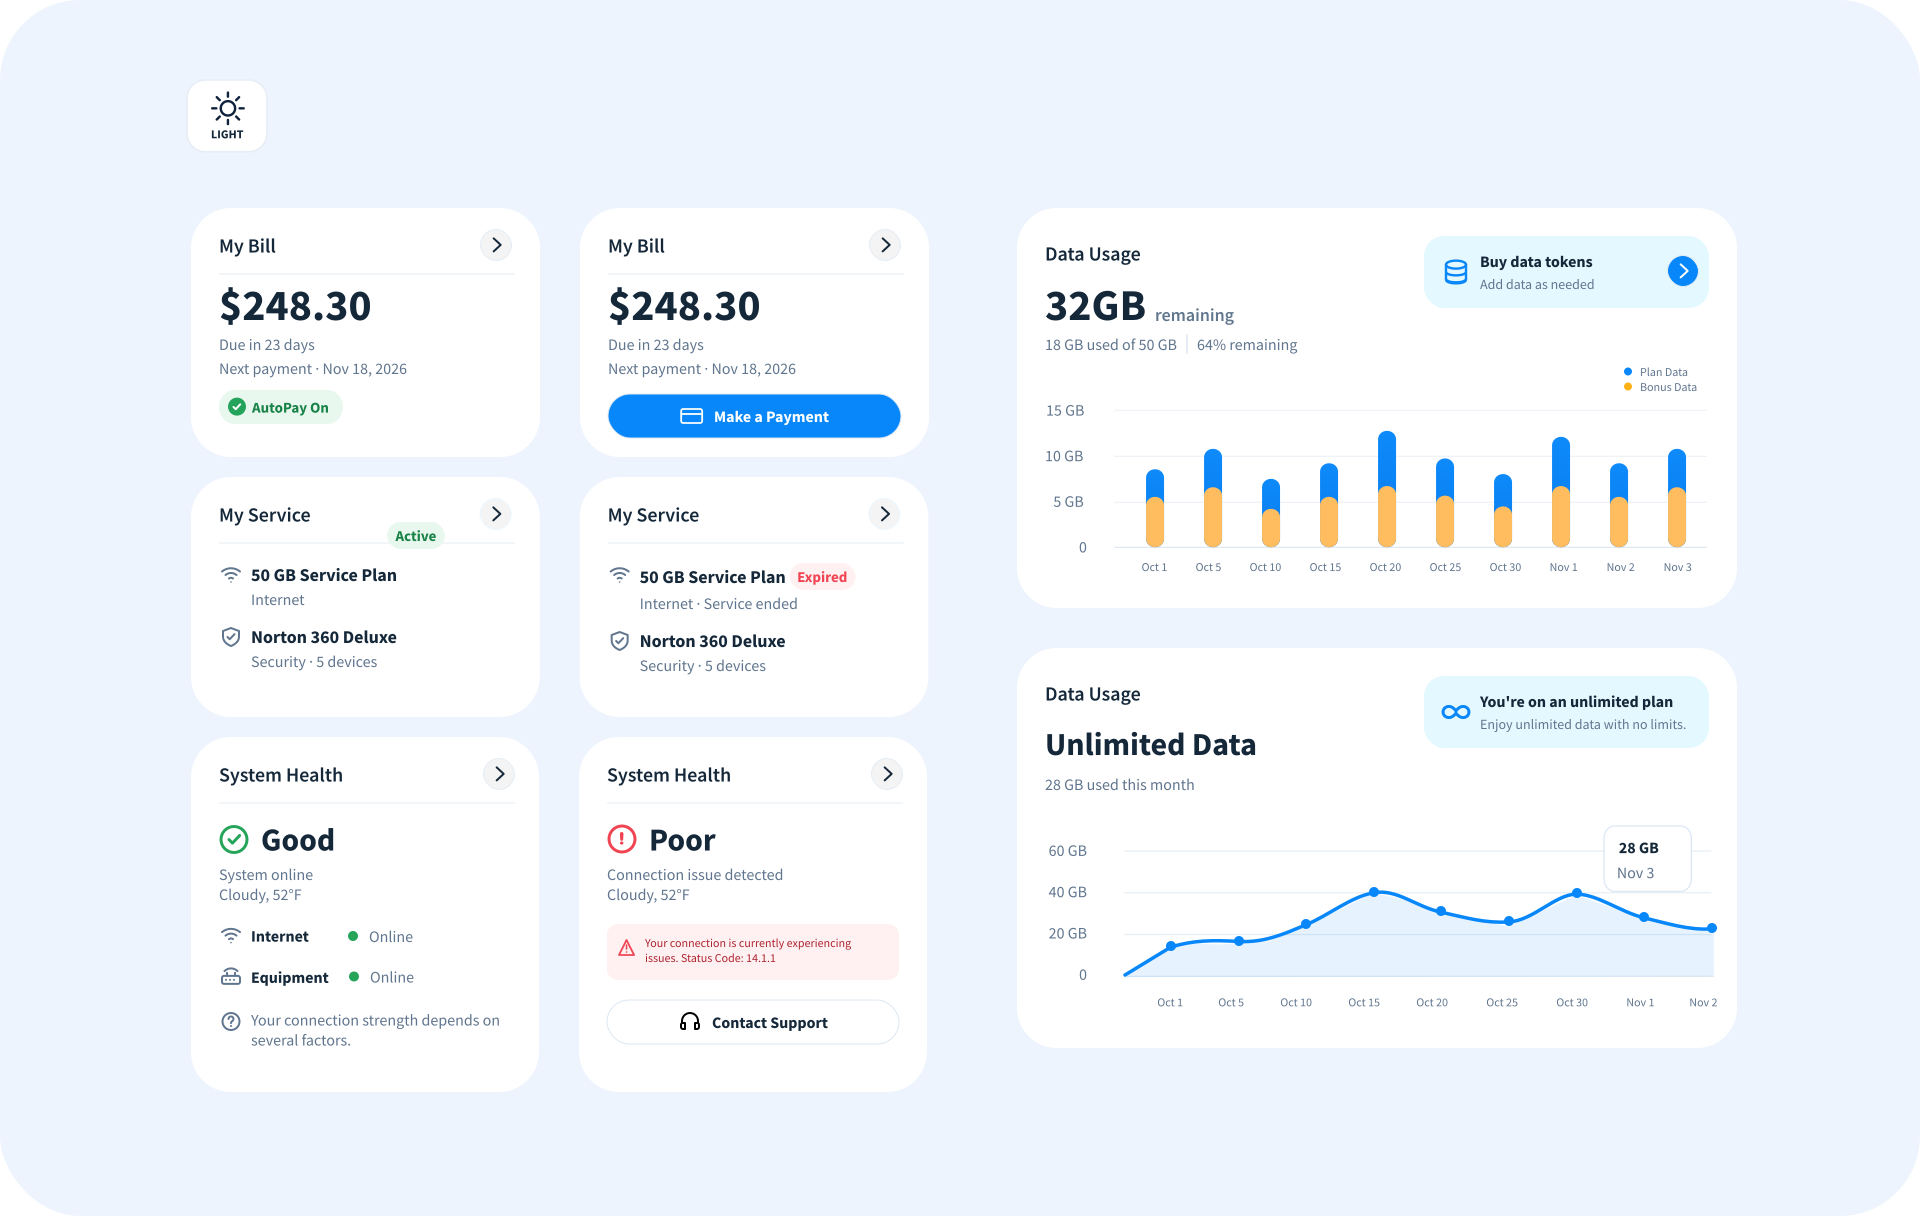
01 / Light themeComponent states
HughesNet light theme UI component states
Light theme: component variants and status treatments
02 / Dark themeComponent states
HughesNet dark theme UI component states
Dark theme: corresponding component variants and status treatments
10 / 13 · Final design

A clearer dashboard, built around the customer.

One flexible experience brings billing, usage, service status, and support into focus without making every module compete for attention.

Customer portal / desktop 01 / Light
HughesNet final dashboard design V2 with left navigation, Quick Actions, account cards, expanded data usage, and a supporting right rail
Designed for clarity at a glance1920 × 1429
01 / Priority

What matters, first.

Key account information and next actions sit at the top of the visual hierarchy.

02 / System

One coherent language.

Quick Actions, billing, and service sit across the top row, while the expanded usage chart anchors the main workspace.

03 / Flexibility

Built for real conditions.

The same system accommodates different account and service states.

11 / 13 · Design system

One visual language.
Every interaction.

Beyond the dashboard, a cohesive design system brings together color, typography, components, and iconography to make the customer experience consistent and scalable.
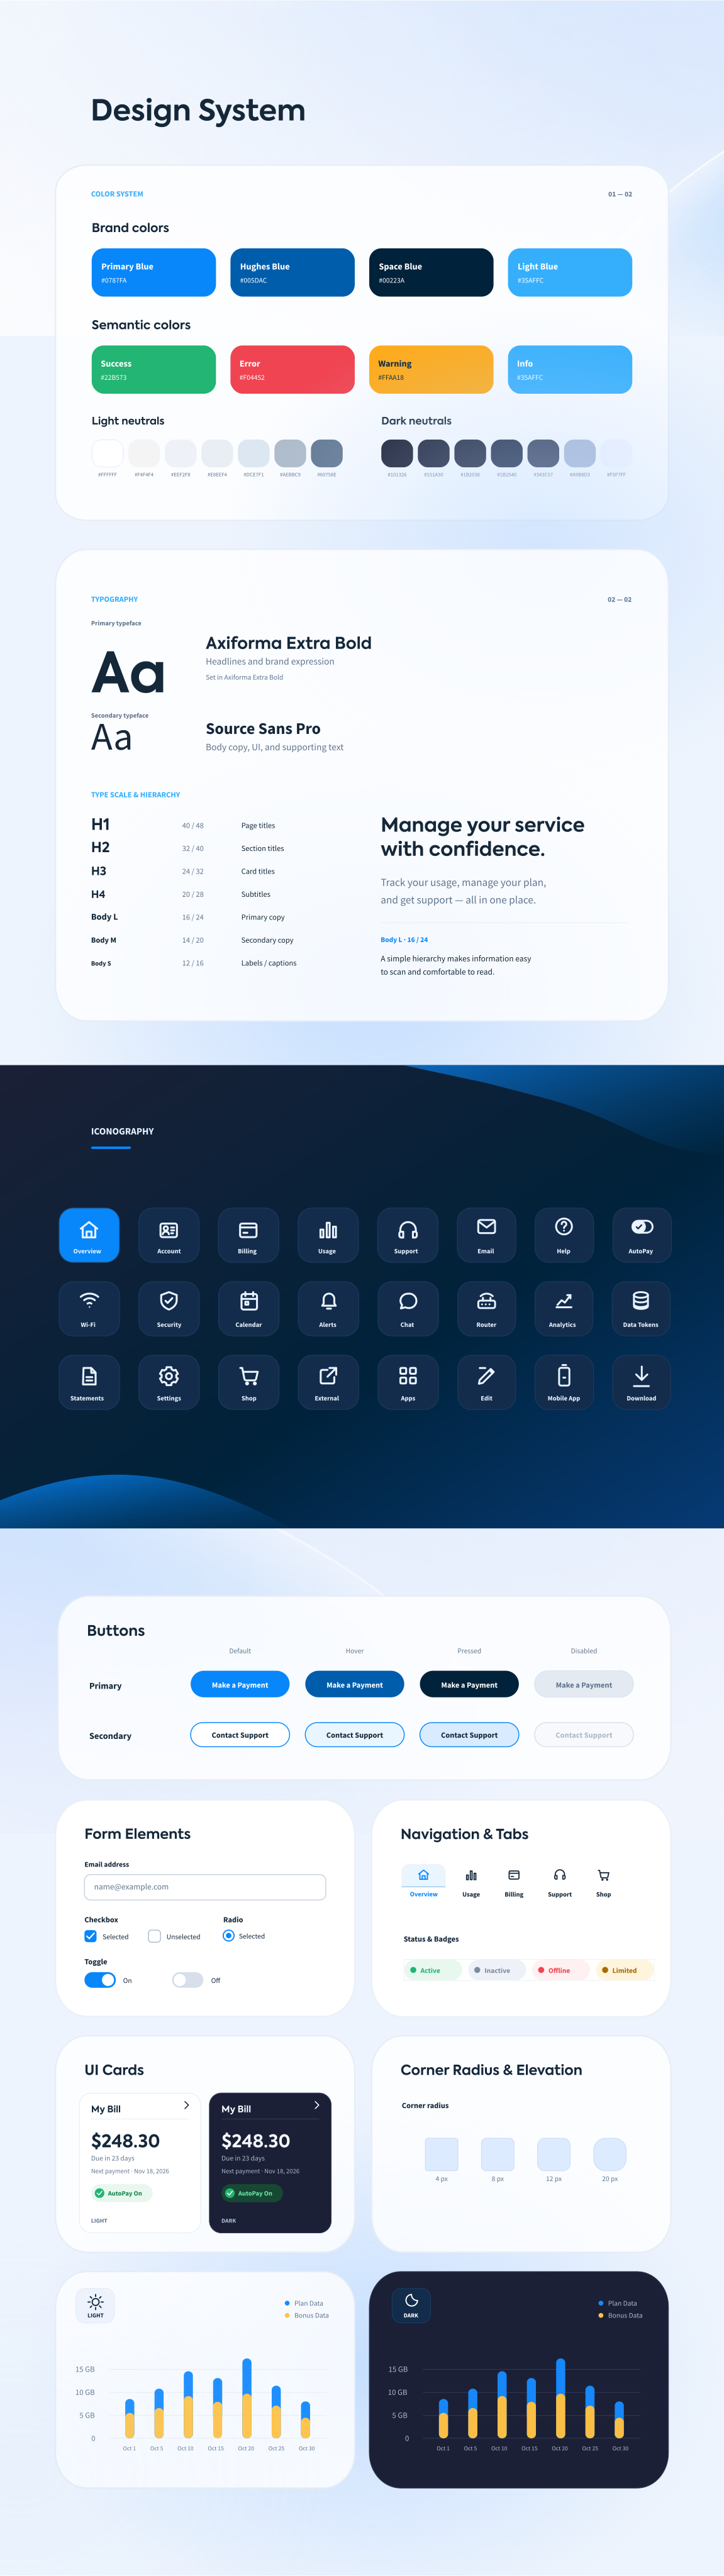
HughesNet / design systemVisual language and UI components
HughesNet design system showing colors, typography, components and iconography
Design foundationBuilt for consistency across customer touchpoints.
12 / 13 · Impact

A better experience customers returned to

Post-launch observations showed increased returning users, fewer support calls, and positive feedback.

↗ Returning users

Post-launch measurements showed more customers returning to the portal.

↘ Support calls

Customer service call volume decreased after the redesign.

Positive feedback

Customers responded positively to the improved experience.

Directional outcomes confirmed by the project designer; exact percentages and measurement windows were not provided.

13 / 13 · Learnings

What I learned

Designing a better customer portal wasn't just about simplifying the interface. It required balancing everyday customer tasks with business priorities, deciding what deserved prominence, and making the experience work across different account conditions and screen sizes.

Prioritize the actions customers need most, while keeping secondary information accessible without adding unnecessary complexity.